

SPSS Kolmogorov-Smirnov Test for Normality
An alternative normality test is the Shapiro-Wilk test .
What is a Kolmogorov-Smirnov normality test?
Spss kolmogorov-smirnov test from npar tests, spss kolmogorov-smirnov test from examine variables, reporting a kolmogorov-smirnov test, wrong results in spss, kolmogorov-smirnov normality test - limited usefulness.

The Kolmogorov-Smirnov test examines if scores are likely to follow some distribution in some population. For avoiding confusion, there's 2 Kolmogorov-Smirnov tests:
- there's the one sample Kolmogorov-Smirnov test for testing if a variable follows a given distribution in a population. This “given distribution” is usually -not always- the normal distribution , hence “Kolmogorov-Smirnov normality test”.
- there's also the (much less common) independent samples Kolmogorov-Smirnov test for testing if a variable has identical distributions in 2 populations.
In theory, “Kolmogorov-Smirnov test” could refer to either test (but usually refers to the one-sample Kolmogorov-Smirnov test) and had better be avoided. By the way, both Kolmogorov-Smirnov tests are present in SPSS .
Kolmogorov-Smirnov Test - Simple Example
So say I've a population of 1,000,000 people. I think their reaction times on some task are perfectly normally distributed. I sample 233 of these people and measure their reaction times. Now the observed frequency distribution of these will probably differ a bit -but not too much- from a normal distribution. So I run a histogram over observed reaction times and superimpose a normal distribution with the same mean and standard deviation. The result is shown below.

The frequency distribution of my scores doesn't entirely overlap with my normal curve. Now, I could calculate the percentage of cases that deviate from the normal curve -the percentage of red areas in the chart. This percentage is a test statistic: it expresses in a single number how much my data differ from my null hypothesis. So it indicates to what extent the observed scores deviate from a normal distribution. Now, if my null hypothesis is true, then this deviation percentage should probably be quite small. That is, a small deviation has a high probability value or p-value. Reversely, a huge deviation percentage is very unlikely and suggests that my reaction times don't follow a normal distribution in the entire population. So a large deviation has a low p-value . As a rule of thumb, we reject the null hypothesis if p < 0.05. So if p < 0.05, we don't believe that our variable follows a normal distribution in our population.
Kolmogorov-Smirnov Test - Test Statistic
So that's the easiest way to understand how the Kolmogorov-Smirnov normality test works. Computationally, however, it works differently: it compares the observed versus the expected cumulative relative frequencies as shown below.

The Kolmogorov-Smirnov test uses the maximal absolute difference between these curves as its test statistic denoted by D. In this chart, the maximal absolute difference D is (0.48 - 0.41 =) 0.07 and it occurs at a reaction time of 960 milliseconds. Keep in mind that D = 0.07 as we'll encounter it in our SPSS output in a minute.
The Kolmogorov-Smirnov test in SPSS
There's 2 ways to run the test in SPSS:

We'll demonstrate both methods using speedtasks.sav throughout, part of which is shown below.

Our main research question is which of the reaction time variables is likely to be normally distributed in our population? These data are a textbook example of why you should thoroughly inspect your data before you start editing or analyzing them. Let's do just that and run some histograms from the syntax below.

Note that some distributions do not look plausible at all. But which ones are likely to be normally distributed?

Next, we just fill out the dialog as shown below.

Clicking P aste results in the syntax below. Let's run it.
Kolmogorov-Smirnov Test Syntax from Nonparametric Tests
First off, note that the test statistic for our first variable is 0.073 -just like we saw in our cumulative relative frequencies chart a bit earlier on. The chart holds the exact same data we just ran our test on so these results nicely converge. Regarding our research question: only the reaction times for trial 4 seem to be normally distributed.

As a rule of thumb, we conclude that a variable is not normally distributed if “Sig.” < 0.05. So both the Kolmogorov-Smirnov test as well as the Shapiro-Wilk test results suggest that only Reaction time trial 4 follows a normal distribution in the entire population. Further, note that the Kolmogorov-Smirnov test results are identical to those obtained from NPAR TESTS .
For reporting our test results following APA guidelines, we'll write something like “a Kolmogorov-Smirnov test indicates that the reaction times on trial 1 do not follow a normal distribution, D(233) = 0.07, p = 0.005.” For additional variables, try and shorten this but make sure you include
- D (for “difference”), the Kolmogorov-Smirnov test statistic ,
- df , the degrees of freedom (which is equal to N) and
- p , the statistical significance .

If you're a student who just wants to pass a test, you can stop reading now . Just follow the steps we discussed so far and you'll be good.
Right, now let's run the exact same tests again in SPSS version 18 and take a look at the output.

In this output, the exact p-values are included and -fortunately- they are very close to the asymptotic p-values. Less fortunately, though, the SPSS version 18 results are wildly different from the SPSS version 24 results we reported thus far. The reason seems to be the Lilliefors significance correction which is applied in newer SPSS versions. The result seems to be that the asymptotic significance levels differ much more from the exact significance than they did when the correction is not implied. This raises serious doubts regarding the correctness of the “Lilliefors results” -the default in newer SPSS versions. Converging evidence for this suggestion was gathered by my colleague Alwin Stegeman who reran all tests in Matlab . The Matlab results agree with the SPSS 18 results and -hence- not with the newer results.

The Kolmogorov-Smirnov test is often to test the normality assumption required by many statistical tests such as ANOVA , the t-test and many others. However, it is almost routinely overlooked that such tests are robust against a violation of this assumption if sample sizes are reasonable, say N ≥ 25. The underlying reason for this is the central limit theorem. Therefore, normality tests are only needed for small sample sizes if the aim is to satisfy the normality assumption. Unfortunately, small sample sizes result in low statistical power for normality tests. This means that substantial deviations from normality will not result in statistical significance. The test says there's no deviation from normality while it's actually huge. In short, the situation in which normality tests are needed -small sample sizes- is also the situation in which they perform poorly.
Thanks for reading.
Tell us what you think!
This tutorial has 32 comments:.
By Samson on August 27th, 2023
It helps a lot Thanks
By EJAZ on December 19th, 2023
Nice sir this is attributes able thanks you so much .
Normality test
One of the most common assumptions for statistical tests is that the data used are normally distributed. For example, if you want to run a t-test or an ANOVA , you must first test whether the data or variables are normally distributed.
The assumption of normal distribution is also important for linear regression analysis , but in this case it is important that the error made by the model is normally distributed, not the data itself.
Nonparametric tests
If the data are not normally distributed, the above procedures cannot be used and non-parametric tests must be used. Non-parametric tests do not assume that the data are normally distributed.
How is the normal distribution tested?
Normal distribution can be tested either analytically (statistical tests) or graphically. The most common analytical tests to check data for normal distribution are the:
- Kolmogorov-Smirnov Test
- Shapiro-Wilk Test
- Anderson-Darling Test
For graphical verification, either a histogram or, better, the Q-Q plot is used. Q-Q stands for quantile-quantile plot, where the actually observed distribution is compared with the theoretically expected distribution.
Statistical tests for normal distribution
To test your data analytically for normal distribution, there are several test procedures, the best known being the Kolmogorov-Smirnov test, the Shapiro-Wilk test, and the Anderson Darling test.

In all of these tests, you are testing the null hypothesis that your data are normally distributed. The null hypothesis is that the frequency distribution of your data is normally distributed. To reject or not reject the null hypothesis, all these tests give you a p-value . What matters is whether this p-value is less than or greater than 0.05.
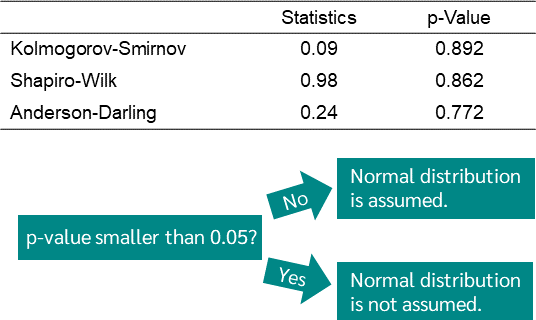
If the p-value is less than 0.05, this is interpreted as a significant deviation from the normal distribution and it can be assumed that the data are not normally distributed. If the p-value is greater than 0.05 and you want to be statistically clean, you cannot necessarily say that the frequency distribution is normal, you just cannot reject the null hypothesis.
In practice, a normal distribution is assumed for values greater than 0.05, although this is not entirely correct. Nevertheless, the graphical solution should always be considered.
Note: The Kolmogorov-Smirnov test and the Anderson-Darling test can also be used to test distributions other than the normal distribution.
Disadvantage of the analytical tests for normal distribution
Unfortunately, the analytical method has a major drawback, which is why more and more attention is being paid to graphical methods.
The problem is that the calculated p-value is affected by the size of the sample. Therefore, if you have a very small sample, your p-value may be much larger than 0.05, but if you have a very very large sample from the same population, your p-value may be smaller than 0.05.
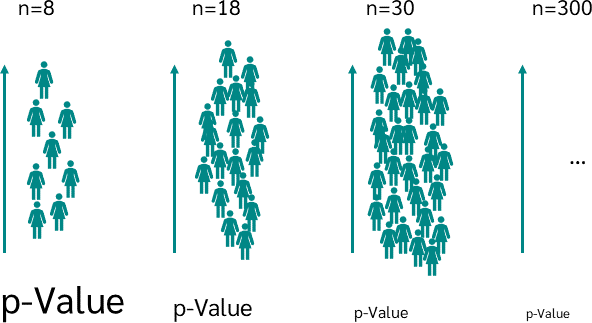
If we assume that the distribution in the population deviates only slightly from the normal distribution, we will get a very large p-value with a very small sample and therefore assume that the data are normally distributed. However, if you take a larger sample, the p-value gets smaller and smaller, even though the samples are from the same population with the same distribution. With a very large sample, you can even get a p-value of less than 0.05, rejecting the null hypothesis of normal distribution.
To avoid this problem, graphical methods are increasingly being used.
Graphical test for normal distribution
If the normal distribution is tested graphically, one looks either at the histogram or even better the QQ plot.
If you want to check the normal distribution using a histogram, plot the normal distribution on the histogram of your data and check that the distribution curve of the data approximately matches the normal distribution curve.
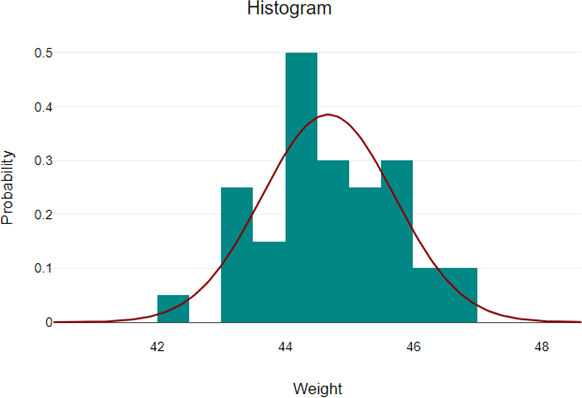
A better way to do this is to use a quantile-quantile plot, or Q-Q plot for short. This compares the theoretical quantiles that the data should have if they were perfectly normal with the quantiles of the measured values.
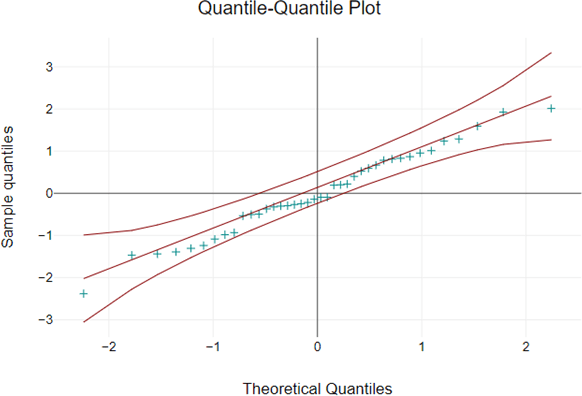
If the data were perfectly normally distributed, all points would lie on the line. The further the data deviates from the line, the less normally distributed the data is.
In addition, DATAtab plots the 95% confidence interval. If all or almost all of the data fall within this interval, this is a very strong indication that the data are normally distributed. They are not normally distributed if, for example, they form an arc and are far from the line in some areas.
Test Normal distribution in DATAtab
When you test your data for normal distribution with DATAtab, you get the following evaluation, first the analytical test procedures clearly arranged in a table, then the graphical test procedures.
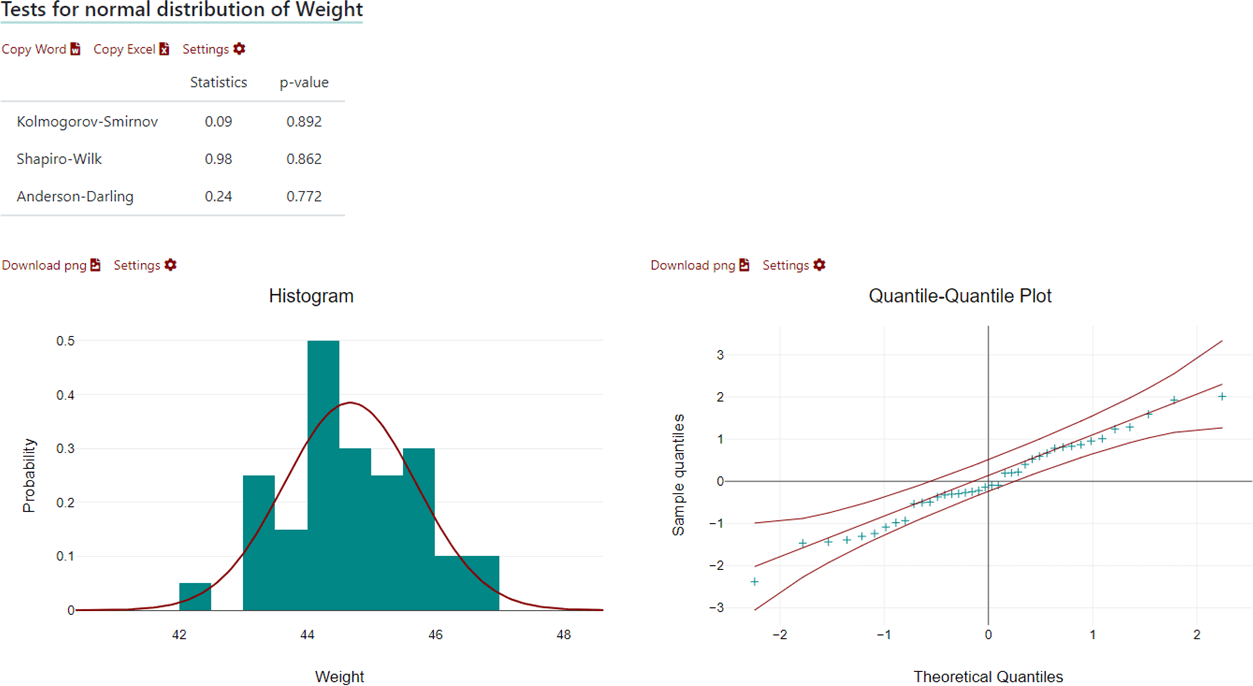
If you want to test your data for normal distribution, simply copy your data into the table on DATAtab, click on descriptive statistics and then select the variable you want to test for normal distribution. Then, just click on Test Normal Distribution and you will get the results.
Furthermore, if you are calculating a hypothesis test with DATAtab, you can test the assumptions for each hypothesis test, if one of the assumptions is the normal distribution, then you will get the test for normal distribution in the same way.
Statistics made easy
- many illustrative examples
- ideal for exams and theses
- statistics made easy on 412 pages
- 5rd revised edition (April 2024)
- Only 8.99 €

"Super simple written"
"It could not be simpler"
"So many helpful examples"

Cite DATAtab: DATAtab Team (2024). DATAtab: Online Statistics Calculator. DATAtab e.U. Graz, Austria. URL https://datatab.net
On Statistics
Examining normality: the secrets of the kolmogorov-smirnov test.
In the realm of statistics, where data speaks volumes through its distribution, normality , depicted by the iconic bell curve, holds a significant position. However, not all data conforms to this pattern. Enter the Kolmogorov-Smirnov (KS) test , a statistical hero adept at assessing whether your data aligns with the normal distribution. This article delves into the world of the KS test, providing formulas, interpretations, and insights to empower you in identifying normality in your data.
Understanding Normality
Imagine measuring heights of individuals in a population. Their heights wouldn’t be identical; some would be taller, some shorter, forming a bell-shaped curve with most individuals clustered around the average height, and fewer falling towards the extremes. This represents a normal distribution , characterized by specific mathematical properties. Data that closely resembles this curve is considered normally distributed .
Why Normality Matters
Many statistical tests, including t-tests, ANOVA, and linear regression, rely on the assumption of normality for accurate results. When data deviates significantly from normality, these tests might produce misleading conclusions.
Enter the Kolmogorov-Smirnov Test
While visual tools like histograms and Q-Q plots offer hints, the KS test formally assesses normality . It compares the cumulative distribution function (CDF) of your data to the theoretical CDF of a normal distribution , calculating a statistic called the D statistic .
Formula Focus: Demystifying the Calculations
The KS statistic (D) represents the maximum absolute difference between the two CDFs:
- F(x) is the CDF of the normal distribution with the same mean and standard deviation as your data.
- S(x) is the empirical CDF of your data, calculated as the proportion of data points less than or equal to x.
Higher D values indicate larger discrepancies between your data and the normal distribution.
Interpreting the P-value
The KS test also calculates a p-value , indicating the probability of observing such a D statistic by chance, assuming normality. Lower p-values (typically below 0.05) suggest rejecting the null hypothesis (data is not normally distributed).
Beyond the Formula: Considerations and Cautions
Remember, no test is perfect:
- Sample size: The KS test performs well with smaller sample sizes (n > 30) compared to the Shapiro-Wilk test. However, for very small samples (< 50), consider exact methods or visual inspection.
- Tail sensitivity: The KS test is more sensitive to deviations in the tails of the distribution than deviations around the center. Consider the Shapiro-Wilk test if you suspect non-normality primarily in the center.
Leave a Reply Cancel reply
Your email address will not be published. Required fields are marked *
Save my name, email, and website in this browser for the next time I comment.
7.5 - Tests for Error Normality
To complement the graphical methods just considered for assessing residual normality, we can perform a hypothesis test in which the null hypothesis is that the errors have a normal distribution. A large p -value and hence failure to reject this null hypothesis is a good result. It means that it is reasonable to assume that the errors have a normal distribution. Typically, assessment of the appropriate residual plots is sufficient to diagnose deviations from normality. However, a more rigorous and formal quantification of normality may be requested. So this section provides a discussion of some common testing procedures (of which there are many) for normality. For each test discussed below, the formal hypothesis test is written as:
\(\begin{align*} \nonumber H_{0}&\colon \textrm{the errors follow a normal distribution} \\ \nonumber H_{A}&\colon \textrm{the errors do not follow a normal distribution}. \end{align*}\)
While hypothesis tests are usually constructed to reject the null hypothesis, this is a case where we actually hope we fail to reject the null hypothesis as this would mean that the errors follow a normal distribution.
Anderson-Darling Test
The Anderson-Darling Test measures the area between a fitted line (based on the chosen distribution) and a nonparametric step function (based on the plot points). The statistic is a squared distance that is weighted more heavily in the tails of the distribution. Smaller Anderson-Darling values indicate that the distribution fits the data better. The test statistic is given by:
\(\begin{equation*} A^{2}=-n-\sum_{i=1}^{n}\frac{2i-1}{n}(\log \textrm{F}(e_{i})+\log (1-\textrm{F}(e_{n+1-i}))), \end{equation*}\)
where \(\textrm{F}(\cdot)\) is the cumulative distribution of the normal distribution. The test statistic is compared against the critical values from a normal distribution in order to determine the p -value.
The Anderson-Darling test is available in some statistical software. To illustrate here's statistical software output for the example on IQ and physical characteristics from Lesson 5 ( IQ Size data ), where we've fit a model with PIQ as the response and Brain and Height as the predictors:
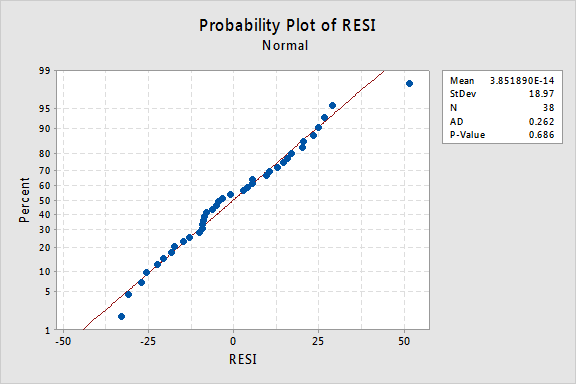
Since the Anderson-Darling test statistic is 0.262 with an associated p -value of 0.686, we fail to reject the null hypothesis and conclude that it is reasonable to assume that the errors have a normal distribution
Shapiro-Wilk Test
The Shapiro-Wilk Test uses the test statistic
\(\begin{equation*} W=\dfrac{\biggl(\sum_{i=1}^{n}a_{i}e_{(i)}\biggr)^{2}}{\sum_{i=1}^{n}(e_{i}-\bar{e})^{2}}, \end{equation*} \)
where \(e_{i}\) pertains to the \(i^{th}\) largest value of the error terms and the \(a_i\) values are calculated using the means, variances, and covariances of the \(e_{i}\). W is compared against tabulated values of this statistic's distribution. Small values of W will lead to the rejection of the null hypothesis.
The Shapiro-Wilk test is available in some statistical software. For the IQ and physical characteristics model with PIQ as the response and Brain and Height as the predictors, the value of the test statistic is 0.976 with an associated p-value of 0.576, which leads to the same conclusion as for the Anderson-Darling test.

Ryan-Joiner Test
The Ryan-Joiner Test is a simpler alternative to the Shapiro-Wilk test. The test statistic is actually a correlation coefficient calculated by
\(\begin{equation*} R_{p}=\dfrac{\sum_{i=1}^{n}e_{(i)}z_{(i)}}{\sqrt{s^{2}(n-1)\sum_{i=1}^{n}z_{(i)}^2}}, \end{equation*}\)
where the \(z_{(i)}\) values are the z -score values (i.e., normal values) of the corresponding \(e_{(i)}\) value and \(s^{2}\) is the sample variance. Values of \(R_{p}\) closer to 1 indicate that the errors are normally distributed.
The Ryan-Joiner test is available in some statistical software. For the IQ and physical characteristics model with PIQ as the response and Brain and Height as the predictors, the value of the test statistic is 0.988 with an associated p-value > 0.1, which leads to the same conclusion as for the Anderson-Darling test.
Kolmogorov-Smirnov Test
The Kolmogorov-Smirnov Test (also known as the Lilliefors Test ) compares the empirical cumulative distribution function of sample data with the distribution expected if the data were normal. If this observed difference is sufficiently large, the test will reject the null hypothesis of population normality. The test statistic is given by:
\(\begin{equation*} D=\max(D^{+},D^{-}), \end{equation*}\)
\(\begin{align*} D^{+}&=\max_{i}(i/n-\textrm{F}(e_{(i)}))\\ D^{-}&=\max_{i}(\textrm{F}(e_{(i)})-(i-1)/n), \end{align*}\)
The test statistic is compared against the critical values from a normal distribution in order to determine the p -value.
The Kolmogorov-Smirnov test is available in some statistical software. For the IQ and physical characteristics model with PIQ as the response and Brain and Height as the predictors, the value of the test statistic is 0.097 with an associated p -value of 0.490, which leads to the same conclusion as for the Anderson-Darling test.
- Python Tutorial
- Interview Questions
- Python Quiz
- Python Projects
- Practice Python
- Data Science With Python
- Python Web Dev
- DSA with Python
- Python OOPs
Kolmogorov-Smirnov Test (KS Test)
The Kolmogorov-Smirnov (KS) test is a non-parametric method for comparing distributions, essential for various applications in diverse fields.
In this article, we will look at the non-parametric test which can be used to determine whether the shape of the two distributions is the same or not.
What is Kolmogorov-Smirnov Test?
Kolmogorov–Smirnov Test is a completely efficient manner to determine if two samples are significantly one of a kind from each other. It is normally used to check the uniformity of random numbers. Uniformity is one of the maximum important properties of any random number generator and the Kolmogorov–Smirnov check can be used to check it.
The Kolmogorov–Smirnov test is versatile and can be employed to evaluate whether two underlying one-dimensional probability distributions vary. It serves as an effective tool to determine the statistical significance of differences between two sets of data. This test is particularly valuable in various fields, including statistics, data analysis, and quality control, where the uniformity of random numbers or the distributional differences between datasets need to be rigorously examined.
Kolmogorov Distribution
The Kolmogorov distribution, often denoted as D, represents the cumulative distribution function (CDF) of the maximum difference between the empirical distribution function of the sample and the cumulative distribution function of the reference distribution.
The probability distribution function (PDF) of the Kolmogorov distribution itself is not expressed in a simple analytical form. Instead, tables or statistical software are commonly used to obtain critical values for the test. The distribution is influenced by sample size, and the critical values depend on the significance level chosen for the test.
- n is the sample size.
- x is the normalized Kolmogorov-Smirnov statistic.
- k is the index of summation in the series
How does Kolmogorov-Smirnov Test work?
Below are the steps for how the Kolmogorov-Smirnov test works:
- Null Hypothesis : The sample follows a specified distribution.
- Alternative Hypothesis: The sample does not follow the specified distribution.
- A theoretical distribution (e.g., normal, exponential) is decided against which you want to test the sample distribution. This distribution is usually based on theoretical expectations or prior knowledge.
- For a one-sample Kolmogorov-Smirnov test, the test statistic (D) represents the maximum vertical deviation between the empirical distribution function (EDF) of the sample and the cumulative distribution function (CDF) of the reference distribution.
- For a two-sample Kolmogorov-Smirnov test, the test statistic compares the EDFs of two independent samples.
- The test statistic (D) is compared to a critical value from the Kolmogorov-Smirnov distribution table or, more commonly, a p-value is calculated.
- If the p-value is less than the significance level (commonly 0.05), the null hypothesis is rejected, suggesting that the sample distribution does not match the specified distribution.
- If the null hypothesis is rejected, it indicates that there is evidence to suggest that the sample does not follow the specified distribution. The alternative hypothesis, suggesting a difference, is accepted.
When use Kolmogorov-Smirnov Test?
The main idea behind using this Kolmogorov-Smirnov Test is to check whether the two samples that we are dealing with follow the same type of distribution or if the shape of the distribution is the same or not.
Let’s a breakdown the scenarios where this test can be applicable:
- Comparison of Probability Distributions : The test is used to evaluate whether two samples exhibit the same probability distribution.
- Compare the shape of the distributions : If we assume that the shapes or probability distributions of the two samples are similar, the test assesses the maximum absolute difference between the cumulative probability distributions of the two functions.
- Check Distributional Differences: The test quantifies the maximum difference between the cumulative probability distributions, and a higher value indicates greater dissimilarity in the shape of the distributions.
- Parametric Test
- Non-Parametric Test
One Sample Kolmogorov-Smirnov Test
The one-sample Kolmogorov-Smirnov (KS) test is used to determine whether a sample comes from a specific distribution. It is particularly useful when the assumption of normality is in question or when dealing with small sample sizes .
Empirical Distribution Function
The empirical distribution function at the value x represents the proportion of data points that are less than or equal to x in the sample. The function can be defined as:
- n is the number of observations in the sample
Kolmogorov–Smirnov Statistic
- sup stands for supremum, which means the largest value over all possible values of x.
- Compute the Empirical Distribution Function
- Calculate the Kolmogorov–Smirnov Statistic
- Compare KS static with Critical Value or P-value
Kolmogorov-Smirnov Test Python One-Sample
- The statistic is relatively small (0.103), suggesting that the EDF and CDF are close.
- Since the p-value (0.218) is greater than the chosen significance level (commonly 0.05), we fail to reject the null hypothesis.
Therefore, we cannot conclude that the sample does not come from the specified distribution (normal distribution with mean and standard deviation).
Two-Sample Kolmogorov–Smirnov Test
The two-sample Kolmogorov-Smirnov (KS) test is used to compare two independent samples to assess whether they come from the same distribution. It’s a distribution-free test that evaluates the maximum vertical difference between the empirical distribution functions (EDFs) of the two samples.
Empirical Distribution Function (EDF):
The empirical distribution function at the value ( x ) in each sample represents the proportion of observations less than or equal to ( x ). Mathematically, the EDFs for the two samples are given by:
For Group 1:
For Group 2:
- sup denotes supremum, representing the largest value over all possible xx values,
- Each ECDF represents the proportion of observations in the corresponding sample that are less than or equal to a particular value of x .
Let’s perform the Two-Sample Kolmogorov–Smirnov Test using the scipy.stats.ks_2samp function. The function calculates the Kolmogorov–Smirnov statistic for two samples to find out if two samples come from different distributions or not.
Kolmogorov-Smirnov Test Python Two-Sample
- The null hypothesis assumes that the two samples come from the same distribution.
- The decision is based on comparing the p-value with a chosen significance level (e.g., 0.05). If the p-value is less than the significance level, reject the null hypothesis, indicating that the two samples come from different distributions.
- The statistic is, indicating a relatively large discrepancy between the two sample distributions.
- The small p-value suggests strong evidence against the null hypothesis that the two samples come from the same distribution.
Therefore, two samples come from different distributions.
One-Sample KS Test vs Two-Sample KS Test
Multidimensional kolmogorov-smirnov testing.
The Kolmogorov-Smirnov (KS) test, in its traditional form, is designed for one-dimensional data, where it assesses the similarity between the empirical distribution function (EDF) and a theoretical or another empirical distribution along a single axis. However, when dealing with data in more than one dimension, the extension of the KS test becomes more complex.
In the context of multidimensional data, the concept of the Kolmogorov-Smirnov statistic can be adapted to evaluate differences across multiple dimensions. This adaptation often involves considering the maximum distance or discrepancy in the cumulative distribution functions along each dimension. A generalization of the KS test to higher dimensions is known as the Kolmogorov-Smirnov n-dimensional test.
The Kolmogorov-Smirnov n-dimensional test aims to evaluate whether two samples in multiple dimensions follow the same distribution. The test statistic becomes a function of the maximum differences in cumulative distribution functions along each dimension.
Applications of the Kolmogorov-Smirnov Test
The essential features of the use of the Kolmogorov-Smirnov test are:
Goodness-of-in shape attempting out
The KS check can be used to evaluate how nicely a pattern data set fits a hypothesized distribution. This may be beneficial in determining whether or now not a sample of facts is probable to have been drawn from a particular distribution, together with a ordinary distribution or an exponential distribution. This is frequently used in fields together with finance, engineering, and herbal sciences to verify whether a records set conforms to an predicted distribution, which could have implications for preference-making, version fitting, and prediction.
Two-sample comparison
The KS test is used to evaluate two facts units to decide whether or not they’re drawn from the same underlying distribution. This may be beneficial in assessing whether there are statistically giant differences among statistics units, together with comparing the overall performance of tremendous companies in an test or evaluating the distributions of two precise variables.
It is normally utilized in fields together with social sciences, remedy, and agency to evaluate whether or not there are full-size variations among groups or populations.
Hypothesis sorting Out
Check unique hypotheses about the distributional residences of a records set. For instance, it is able to be used to check whether a facts set is normally distributed or whether or not it follows a specific theoretical distribution. This may be beneficial in verifying assumptions made in statistical analyses or validating version assumptions.
Non-parametric alternative
The K-S test is a non-parametric test, because of this it does no longer require assumptions about the form or parameters of the underlying distributions being in contrast. This makes it a beneficial opportunity to parametric checks, in conjunction with the t-test or ANOVA, at the same time as facts do no longer meet the assumptions of these assessments, along with at the same time as statistics are not generally disbursed, have unknown or unequal variances, or have small pattern sizes.
Limitations of the Kolmogorov-Smirnov Test
- Sensitivity to sample length: K-S check may additionally moreover have confined energy with small sample sizes and may yield statistically sizeable results with large sample sizes even for small versions.
- Assumes independence: K-S test assumes that the records gadgets being compared are unbiased, and might not be appropriate for based facts.
- Limited to non-stop records: K-S take a look at is designed for non-stop statistics and won’t be suitable for discrete or specific information without modifications.
- Lack of sensitivity to precise distributional properties: K-S test assesses fashionable differences among distributions and might not be touchy to variations specially distributional houses.
- Vulnerability to type I error with multiple comparisons: Multiple K-S exams or use of K-S test in a larger hypothesis checking out framework might also boom the threat of type I mistakes.
While versatile, the KS test demands caution in sample size considerations, assumptions, and interpretations to ensure robust and accurate analyses.
Kolmogorov-Smirnov test- FAQs
Q. what is kolmogorov-smirnov test used for.
Used to assess whether a sample follows a specified distribution or to compare two samples’ distributions.
Q. What is the difference between T test and Kolmogorov-Smirnov test?
T-test compares means of two groups; KS test compares entire distributions for similarity or goodness-of-fit.
Q. How do you interpret Kolmogorov-Smirnov test for normality?
If p-value is high (e.g., > 0.05), data may follow normal distribution; low p-value suggests departure.
Q. How do you interpret KS test p value?
If the p-value is below the chosen significance level (commonly 0.05), we would reject the null hypothesis. It indicates significant difference; large p-value (i.e.below the chosen significance level ) suggests no significant difference.
Q. Which normality test is best?
No one-size-fits-all. Anderson-Darling, Shapiro-Wilk, and KS test are commonly used; choice depends on data size and characteristics.
Similar Reads
- How to set height equal to dynamic width (CSS fluid layout) ? To create a fluid layout in CSS, set an element's height to the same value as its dynamic width. This makes the layout more adaptable and responsive since the element's height will automatically change depending on the viewport's width. It is possible to determine the element's height by using the p 2 min read
- How to Set Height Equal to Dynamic Width (CSS fluid layout) in JavaScript ? A key component of constructing a contemporary website in web development is developing an adaptable and dynamic layout. Setting the height of an element equal to its dynamic width, often known as a CSS fluid layout, is a common difficulty in accomplishing this. When the screen size changes and you 4 min read
- How to Create Equal Height Columns in CSS ? Equal Height Columns in CSS refer to ensuring that multiple columns in a layout have the same height, regardless of the content inside each column. This can be achieved using modern CSS techniques like Flexbox, CSS Grid, or the Table display property. Table of Content Using FlexUsing GridUsing Table 3 min read
- How to make div height expand with its content using CSS ? When designing a webpage, ensuring that a div adjusts its height according to its content is important for creating a flexible and responsive layout. By using CSS, you can easily make a div adapt to varying content sizes, which is particularly useful when dealing with dynamic or unpredictable conten 3 min read
- How to Set Viewport Height & Width in CSS ? Set viewport height and width in CSS is essential for creating responsive and visually appealing web designs. We'll explore the concepts of setting viewport height and width by using various methods like CSS Units, Viewport-Relative Units, and keyframe Media Queries. Table of Content Setting viewpor 3 min read
- How to Stretch Elements to Fit the Whole Height of the Browser Window Using CSS? To stretch elements to fit the whole height of the browser window using CSS, you can use "vh" units, where "1vh" equals 1% of the viewport height, so setting the height to "100vh" spans the entire height. Approach: Using CSS height PropertyIn this approach, we are using the Height property to fit th 1 min read
- How to get the height of device screen in JavaScript ? Given an HTML document which is running on a device. The task is to find the height of the working screen device using JavaScript. Prerequisite - How to get the width of device screen in JavaScript ? Example 1: This example uses window.innerHeight property to get the height of the device screen. The 2 min read
- How to fit text container width dynamically according to screen size using CSS ? In this article, we have given a text paragraph and the task is to fit the text width dynamically according to screen size using HTML and CSS. Some of the important properties used in the code are as follows- display-grid: It helps us to display the content on the page in the grid structure.grid-gap 7 min read
- How to Adjust the Width and Height of an iframe to Fit the Content Inside It? When using the <iframe> tag in HTML, the content inside the iframe is displayed with a default size if the width and height attributes are not specified. Even if the dimensions are specified, it can still be difficult to perfectly match the iframe’s size with the content inside it. This can be 4 min read
- jQWidgets jqxLayout height Property jQWidgets is a JavaScript framework for making web-based applications for PC and mobile devices. It is a very powerful, optimized, platform-independent, and widely supported framework. The jqxLayout is used for representing a jQuery widget that is used for the creation of complex layouts with nested 2 min read
- How to Make Flexbox Items of Same Size Using CSS? To make Flexbox items the same size using CSS, you can use various properties to control the dimensions of the items and ensure consistency in layout. By default, Flexbox items can have different sizes based on their content, but with a few CSS changes, you can make them uniform. 1. Using Flex Prope 5 min read
- How to Specify Height to Fit-Content with Tailwind CSS ? Specifying height to fit-content in Tailwind CSS means setting an element’s height to automatically adjust based on its content. Tailwind provides the h-fit utility class, which ensures the element's height dynamically adapts to its content's size. Adjusting Height with h-fit in Tailwind CSSThis app 2 min read
- How to detect the change in DIV's dimension ? The change in a div's dimension can be detected using 2 approaches: Method 1: Checking for changes using the ResizeObserver Interface The ResizeObserver Interface is used to report changes in dimensions of an element. The element to be tracked is first selected using jQuery. A ResizeObserver object 4 min read
- How to Change the Height and Width of an Element with JavaScript? To change the height and width of an element using JavaScript, you can directly manipulate the style property of the element. Here’s a simple guide on how to do it: Example:[GFGTABS] HTML <!DOCTYPE html> <html lang="en"> <head> <meta charset="UTF-8"> <m 1 min read
- Primer CSS Layout width and height Primer CSS is a free open-source CSS framework that is built with the GitHub design system to provide support to the broad spectrum of Github websites. It creates the foundation of the basic style elements such as spacing, typography, and color. This systematic method makes sure our patterns are ste 5 min read
- How to Create Equal Width Table Cell Using CSS ? Creating equal-width table cells using CSS refers to adjusting the table's layout so that all columns maintain the same width. This technique ensures a consistent and organized appearance, making the table content easier to read and visually balanced. Here we are following some common approaches: Ta 3 min read
- How to Set Width and Height of Span Element using CSS ? The <span> tag is used to apply styles or scripting to a specific part of text within a larger block of content. The <span> tag is an inline element, you may encounter scenarios where setting its width and height becomes necessary. This article explores various approaches to set the widt 2 min read
- How to Set 100% Height with Padding/Margin in CSS ? In this article, we'll explore CSS layouts with 100% width/height while accommodating padding and margins. In the process of web page design, it is often faced with scenarios where the intention is to have an element fill the entire width and/or height of its parent container, while also maintaining 3 min read
- How to give a div tag 100% height of the browser window using CSS CSS allows to adjustment of the height of an element using the height property. While there are several units to specify the height of an element. Set the height of a <div> to 100% of its parent container with height: 100%, or use height: 100vh; for a full viewport height, ensuring the <div 2 min read
- Machine Learning
- Python Programs
Improve your Coding Skills with Practice
What kind of Experience do you want to share?

IMAGES
COMMENTS
Aug 27, 2018 · The Kolmogorov-Smirnov test is often to test the normality assumption required by many statistical tests such as ANOVA, the t-test and many others. However, it is almost routinely overlooked that such tests are robust against a violation of this assumption if sample sizes are reasonable, say N ≥ 25.
Illustration of the Kolmogorov–Smirnov statistic. The red line is a model CDF, the blue line is an empirical CDF, and the black arrow is the KS statistic.. Kolmogorov–Smirnov test (K–S test or KS test) is a nonparametric test of the equality of continuous (or discontinuous, see Section 2.2), one-dimensional probability distributions that can be used to test whether a sample came from a ...
The Kolmogorov-Smirnov Goodness of Fit Test (K-S test) compares your data with a known distribution and lets you know if they have the same distribution. Although the test is nonparametric — it doesn’t assume any particular underlying distribution — it is commonly used as a test for normality to see if your data is normally distributed ...
The Kolmogorov-Smirnov Test (also known as the Lilliefors Test) compares the empirical cumulative distribution function of sample data with the distribution expected if the data were normal. If this observed difference is sufficiently large, the test will reject the null hypothesis of population normality. The test statistic is given by:
Statistical tests for normal distribution. To test your data analytically for normal distribution, there are several test procedures, the best known being the Kolmogorov-Smirnov test, the Shapiro-Wilk test, and the Anderson Darling test. In all of these tests, you are testing the null hypothesis that your data are normally distributed.
We will next look at a statistical test to see if this backs up our visual impressions from the histogram. The Kolmogorov-Smirnov test is used to test the null hypothesis that a set of data comes from a Normal distribution. Te s t s o f N o r m a l i t y Kolmogorov-Smirnov Statistic df Sig. Science test score .025 5194 .000 a.
If the null hypothesis is true then, by Theorem 1, we distribution of Dn can be tabulated (it will depend only on n). Moreover, if n is large enough then the distribution of Dn is approximated by Kolmogorov-Smirnov distribution from Theorem 2. On the other hand, suppose that the null hypothesis fails, i.e. F =⇒ F0. Since F is the true c.d.f ...
In the realm of statistics, where data speaks volumes through its distribution, normality, depicted by the iconic bell curve, holds a significant position. However, not all data conforms to this pattern. Enter the Kolmogorov-Smirnov (KS) test, a statistical hero adept at assessing whether your data aligns with the normal distribution. This article delves into the
The Kolmogorov-Smirnov Test (also known as the Lilliefors Test) compares the empirical cumulative distribution function of sample data with the distribution expected if the data were normal. If this observed difference is sufficiently large, the test will reject the null hypothesis of population normality. The test statistic is given by:
Feb 1, 2024 · Kolmogorov–Smirnov Statistic: 0.35833333333333334 P-value: 9.93895980740741e-07 Reject the null hypothesis. The two samples come from different distributions. The statistic is, indicating a relatively large discrepancy between the two sample distributions.